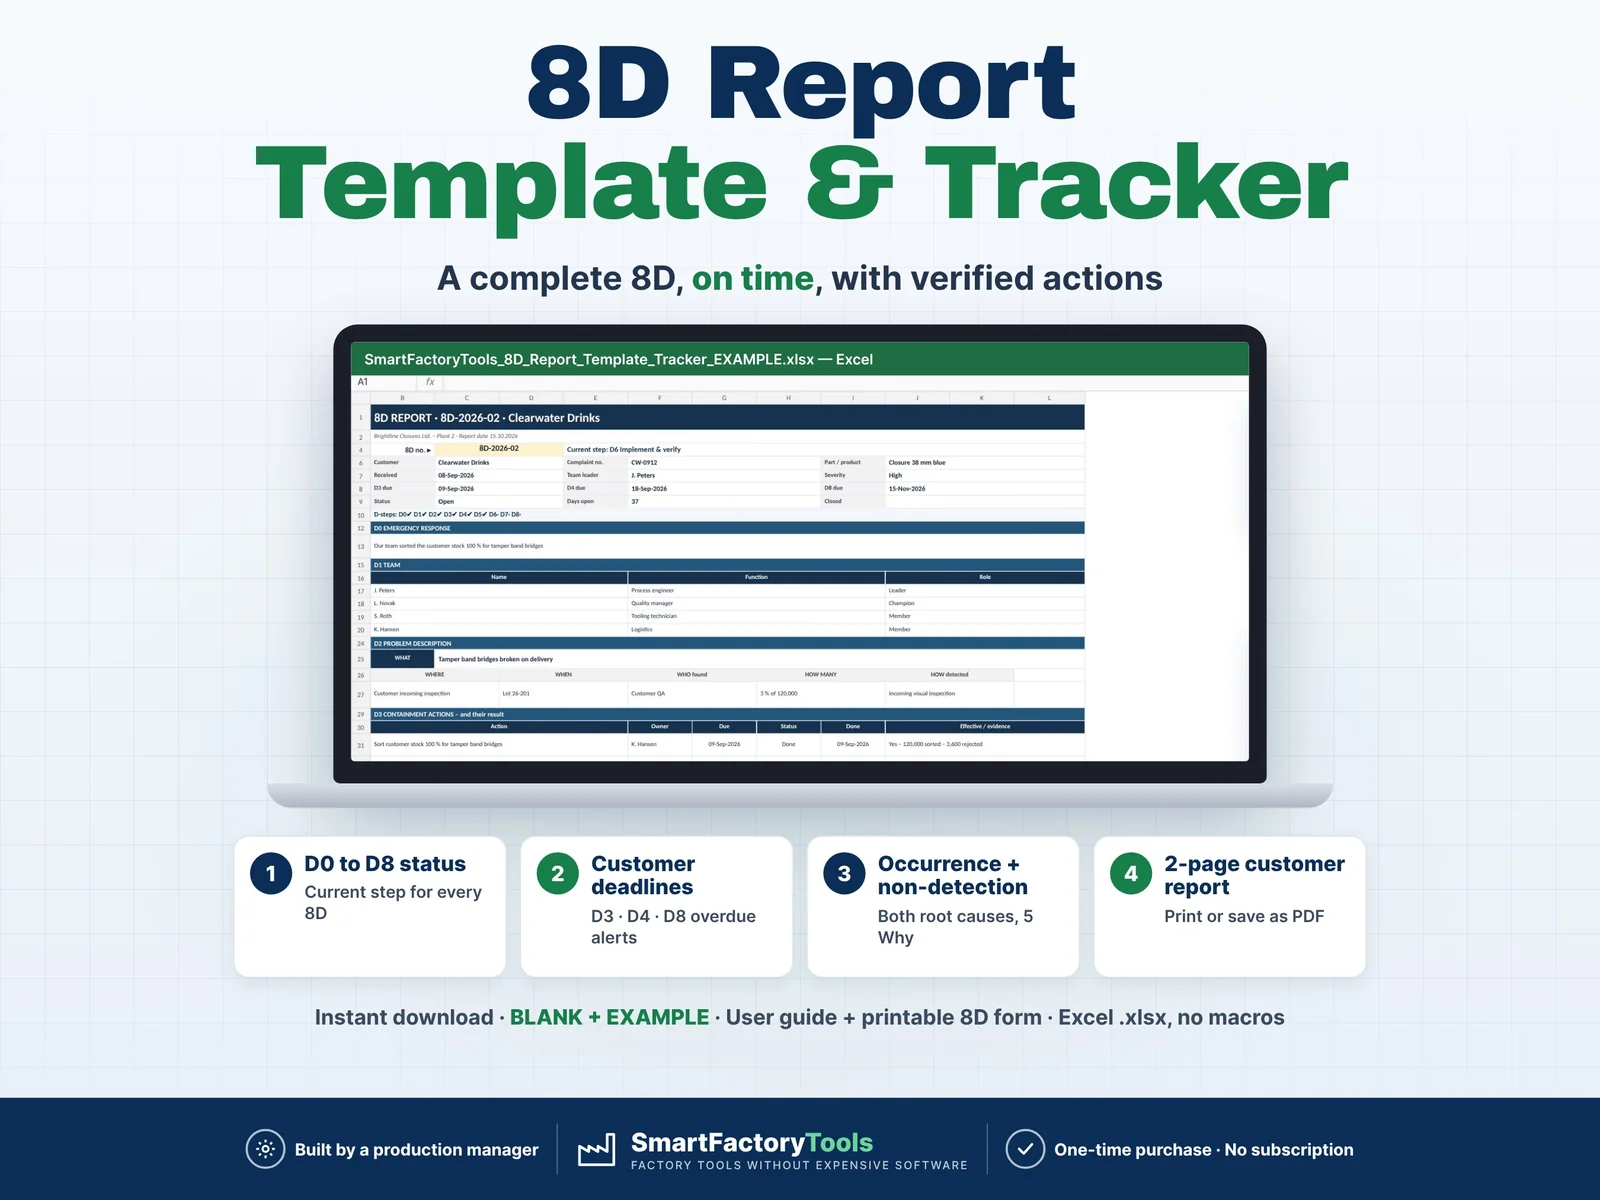
Answer every customer complaint with a complete 8D report – on time, with verified root causes and actions. A professional 8D template and tracker in Excel: D0 to D8, customer deadlines, team, 5 Why, actions and a 2-page customer report for all complaints of your plant.
- D0–D8 status and current step for every 8D
- D3, D4 and D8 customer deadlines with overdue alerts
- Occurrence and non-detection root causes, each with 5 Why
- Instant download: BLANK + EXAMPLE · User guide + printable 8D form
- Built by a production manager · one-time purchase, no subscription, no macros
▶ Requires Microsoft Excel 2016 or newer on a computer (Windows or Mac). Not for Google Sheets, Apple Numbers or mobile apps.
Most 8Ds are written in a Word form at the last minute: containment without quantities, a root cause that says "operator error", no answer to why the defect was not detected, actions marked done without proof – and nobody sees which complaint is about to miss the customer's deadline. This tool takes each complaint through the eight disciplines, checks every step and shows the open deadlines – built by a production manager who answers customer complaints in a food plant.
PLEASE READ BEFORE BUYING
- A PROFESSIONAL TOOL, NOT A ONE-PAGE FORM. One 8D uses several sheets – the complaint and its D-steps (LOG), the team (TEAM), 5 Why chains (WHY) and actions (ACTIONS). The REPORT sheet puts everything on 2 A4 pages. It needs concentration – like a real 8D.
- SHORT SETUP NEEDED. Before the first 8D, enter your customers, people and the deadlines your customers ask for (about 15–30 minutes). A 5-page User Guide explains every sheet, rule and message.
- IT DOES NOT FIND THE ROOT CAUSE FOR YOU. The file structures the 8D and checks that nothing is skipped – verified containment, root causes for occurrence AND non-detection, actions with evidence, prevention, customer approval. Whether the root cause is right depends on your team, your data and your tests.
WHAT IT DOES
- LOG: up to 50 complaints – customer, complaint no., part, received date, leader, severity, D0 emergency response, D2 problem description (what, where, when, who, how many, how detected), D4 root causes, D7 checklist, D8 closure
- D-step status for every 8D: D0 … D8 with ✔ per completed step and the current step – a step only counts when it is really complete
- DEADLINES: D3, D4 and D8 due dates from the received date (default 1 / 10 / 30 days – change them); an agreed customer deadline replaces D8; overdue days in red
- TEAM (D1): leader, champion and members with their function
- WHY (D4): 5 Why chains for OCCURRENCE (why it happened) and NON-DETECTION (why it was not found) – "human error" as root cause is flagged
- ACTIONS: D3 containment, D5/D6 corrective and D7 preventive actions with owner, due date and overdue days – "effective" only counts with evidence (e.g. quantity sorted, Cpk, weeks without defects)
- D7 checklist: PFMEA, control plan, work instruction, similar products, lessons learned
- Every 8D checked – all gaps listed at once; an 8D cannot pass as Closed with incomplete D-steps or without customer approval
- REPORT: customer-ready 8D report on 2 A4 pages for the selected complaint – print or save as PDF
- DASHBOARD: open 8Ds, high severity, overdue deadlines, average days to containment and to closure, 8Ds by step and by customer, overdue actions
WHAT'S INCLUDED (ZIP)
- SmartFactoryTools_8D_Report_Template_Tracker_v1.0_BLANK.xlsx – your own 8Ds
- SmartFactoryTools_8D_Report_Template_Tracker_v1.0_EXAMPLE.xlsx – fictional closure (caps) supplier: 6 complaints in all D-steps (leaking bottles, broken tamper bands, colour shade, black particle, wrong labels, high opening torque)
- User_Guide.pdf – 5 pages: every sheet, D-step rule, deadline and check message explained, plus a worked example
- Quick_Start_Guide.pdf – 2 pages
- Printable_8D_Form.pdf – blank 2-page A4 8D form for the team meeting
Sheets: START_HERE · SETUP · LOG · TEAM · WHY · ACTIONS · REPORT · DASHBOARD · FAQ · LICENSE
HOW IT WORKS
- Log the complaint, write the emergency response (D0) and form the team (D1)
- Describe the problem with facts – 5W2H (D2)
- Contain it and verify the result with quantities (D3)
- 5 Why for occurrence and non-detection – both root causes verified (D4)
- Corrective actions – Done, then effective with evidence (D5 / D6)
- Prevention checklist (D7), customer approval and closure (D8) – print the 2-page report
Yellow cells are your input. Everything else is calculated and protected (no password).
WHO IT'S FOR
Quality managers, supplier quality engineers, customer complaint handlers and production managers in small and mid-size suppliers – packaging, plastics, food and beverage, metal parts, automotive and assembly.
LIMITS
- 50 8Ds · 200 team rows · 150 5 Why chains · 300 actions per file. The report shows up to 6 team members, 4 containment, 6 corrective and 3 preventive actions and 4 why chains (all stay in the sheets).
- Not included: customer-specific 8D forms or supplier portals, photos and attachments, fishbone diagram, Pareto / SPC. No VBA / macros.
Related SmartFactoryTools templates: Root Cause Analysis Toolkit (5 Why + Fishbone), CAPA Tracker, Non-Conformance (NCR) Log & Cost Tracker, PFMEA Template, Control Plan Template.
FAQ
Why two root causes?
Customers expect both: why the defect was made (occurrence) and why it was not found before it reached them (non-detection) – with actions for both.
My customer gave another closing date?
Enter it as the customer deadline – it replaces the D8 deadline for that 8D.
Can I send the report to my customer?
Yes – choose the 8D on the REPORT sheet and print it or save it as PDF.
Can I use it in Google Sheets?
No. It is built and tested for Microsoft Excel 2016 or newer on a computer.
DIGITAL DOWNLOAD
This is a digital product – nothing is shipped. After purchase, download the ZIP from Etsy (Purchases and reviews) on a computer, unzip it and start with the User Guide and the EXAMPLE file.
LICENSE
For use in your own company or organization (any number of sites and users). Reselling, sharing or uploading the template elsewhere is not permitted. The printable form may be copied inside your organization. © SmartFactoryTools · SKU SFT-8D-01
 Lean & Continuous Improvement